Dashboard & Analytics
Your entire business on
one screen
Live metrics, interactive charts, and real-time alerts. Operate with full visibility over your entire payment operation.
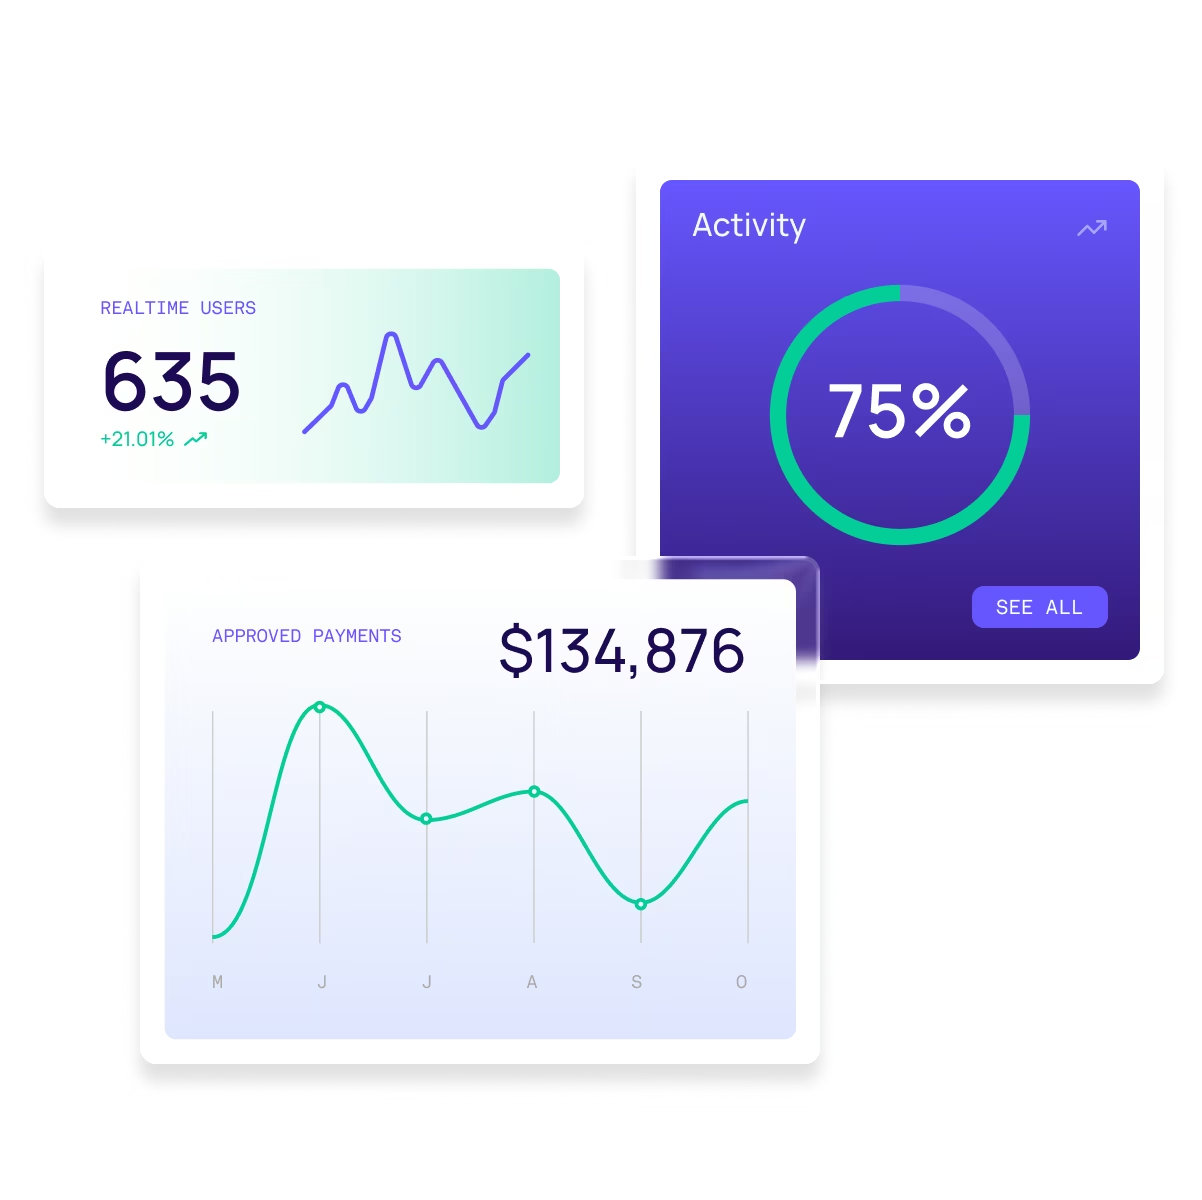
Interactive Dashboard
Explore your transactional data with interactive charts, real-time filters, and metrics updated every second.
Dashboard Capabilities
Everything you need to monitor and analyze your payment operations.
Multi-chart Views
Area, bar, line, pie charts and interactive heatmaps
Advanced Filters
By merchant, payment method, currency, country and period
Live Streaming
Real-time data updates without refreshing
White-Label
Customizable with your brand for your merchants
Multi-format Export
Download in PDF, CSV, Excel and JSON
AI Insights
Automatic anomaly and trend detection
Network Breakdown
Breakdown by network, issuer, acquirer and BIN
Trend Analysis
Automatic period-over-period comparisons
'/%3e%3cdefs%3e%3clinearGradient%20id='paint0_linear_13678_39507'%20x1='649.377'%20y1='0'%20x2='649.377'%20y2='1297.82'%20gradientUnits='userSpaceOnUse'%3e%3cstop%20stop-color='%236756FF'%20stop-opacity='0'/%3e%3cstop%20offset='1'%20stop-color='%2305CD99'/%3e%3c/linearGradient%3e%3c/defs%3e%3c/svg%3e)
'/%3e%3cdefs%3e%3clinearGradient%20id='paint0_linear_13678_39508'%20x1='501.559'%20y1='0'%20x2='501.559'%20y2='1003.12'%20gradientUnits='userSpaceOnUse'%3e%3cstop%20stop-color='%236756FF'%20stop-opacity='0'/%3e%3cstop%20offset='1'%20stop-color='%2305CD99'/%3e%3c/linearGradient%3e%3c/defs%3e%3c/svg%3e)
'/%3e%3cdefs%3e%3clinearGradient%20id='paint0_linear_13678_39509'%20x1='363.037'%20y1='0'%20x2='363.037'%20y2='725.145'%20gradientUnits='userSpaceOnUse'%3e%3cstop%20stop-color='%236756FF'%20stop-opacity='0'/%3e%3cstop%20offset='1'%20stop-color='%2305CD99'/%3e%3c/linearGradient%3e%3c/defs%3e%3c/svg%3e)

Visualize your operation in
real time
Interactive dashboard with live metrics, charts and alerts for informed decision-making.